- Welcome to the Agile Analytics Full Stack Documentation
- 🛠 Getting Started
- General
- [Jira] Connect Agile Analytics to Jira
- [GitLab] Connect Agile Analytics to your GitLab
- [Bitbucket] Connect Agile Analytics to your Bitbucket
- [GitHub] Connect Agile Analytics to your GitHub
- Add repositories to Agile Analytics
- Sprints management
- SAML
- Migration Bug: Post-Mortem
- Add users to your organisation
- Features
Welcome to the Agile Analytics Full Stack Documentation
Agile Analytics Full Stack turns raw engineering data into insights and automation to help you code smarter, move faster, and ship better. This documentation explains each part of the platform — and how it helps reduce friction, track progress, and automate maintenance.
Agile Analytics Full Stack is built on the belief that “to measure is to know” (“meten is weten” in Dutch). Knowing is the first step to improving how software teams work. Born from the question of why some teams thrive while others constantly fight blockers and burnout, the platform embraces the idea that when you know the bottlenecks in the systems you use, the people who operate them can improve the entire workflow. By turning delivery signals from Git, Jira, CI/CD, and cloud into actionable insights, Agile Analytics Full Stack reveals where work gets stuck, what slows teams down, and how to fix it.
This insight-driven approach comes to life through Mission Cards. These focused improvement plans, based on real bottlenecks, are the fuel for Code Crew. This AI automation layer utilises Mission Cards to reduce tech debt, upgrade codebases, and enhance your repositories. This reduces toil, improves productivity, and allows engineers to focus on adding value.
📚 Quick Access by Module
🟨 Overview
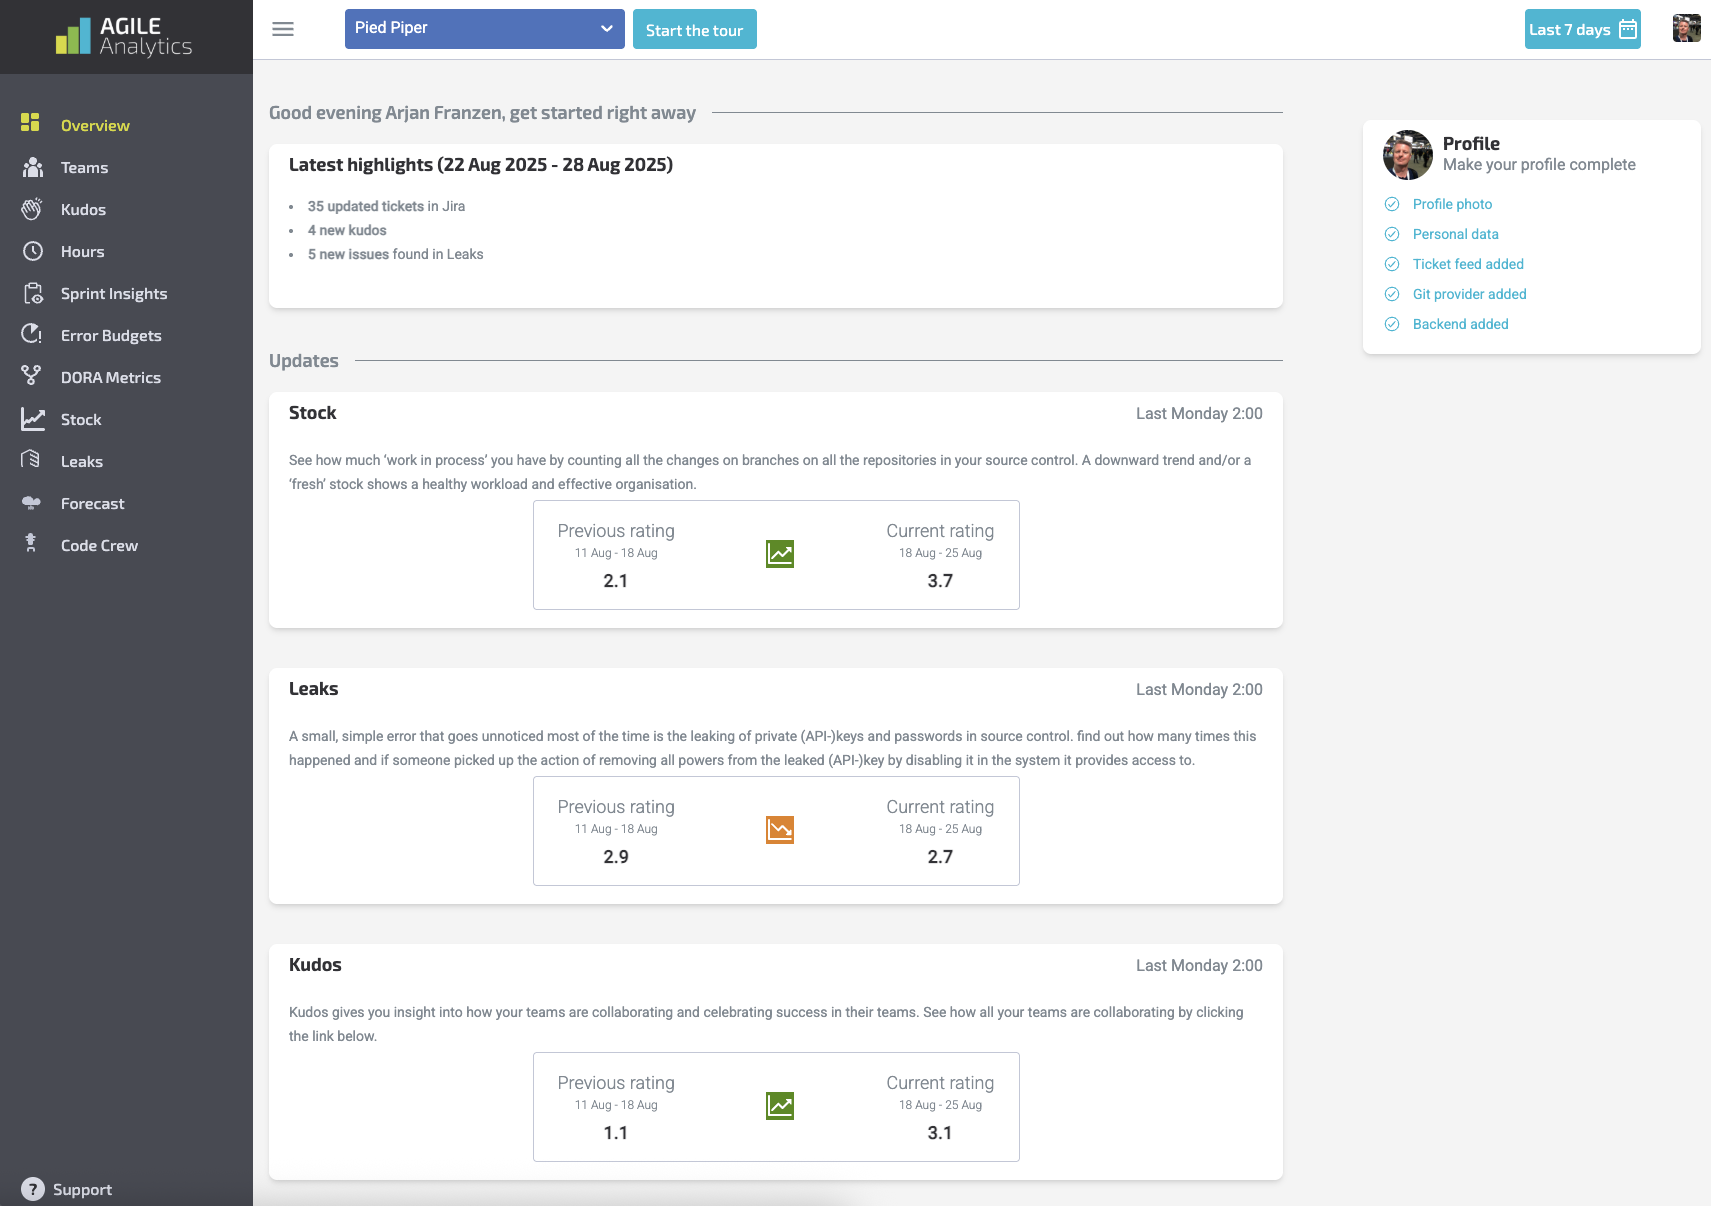
Understand your weekly highlights, team metrics, and changes across time.
-
Weekly Summary Explained
-
How Ratings Are Calculated
👥 Teams
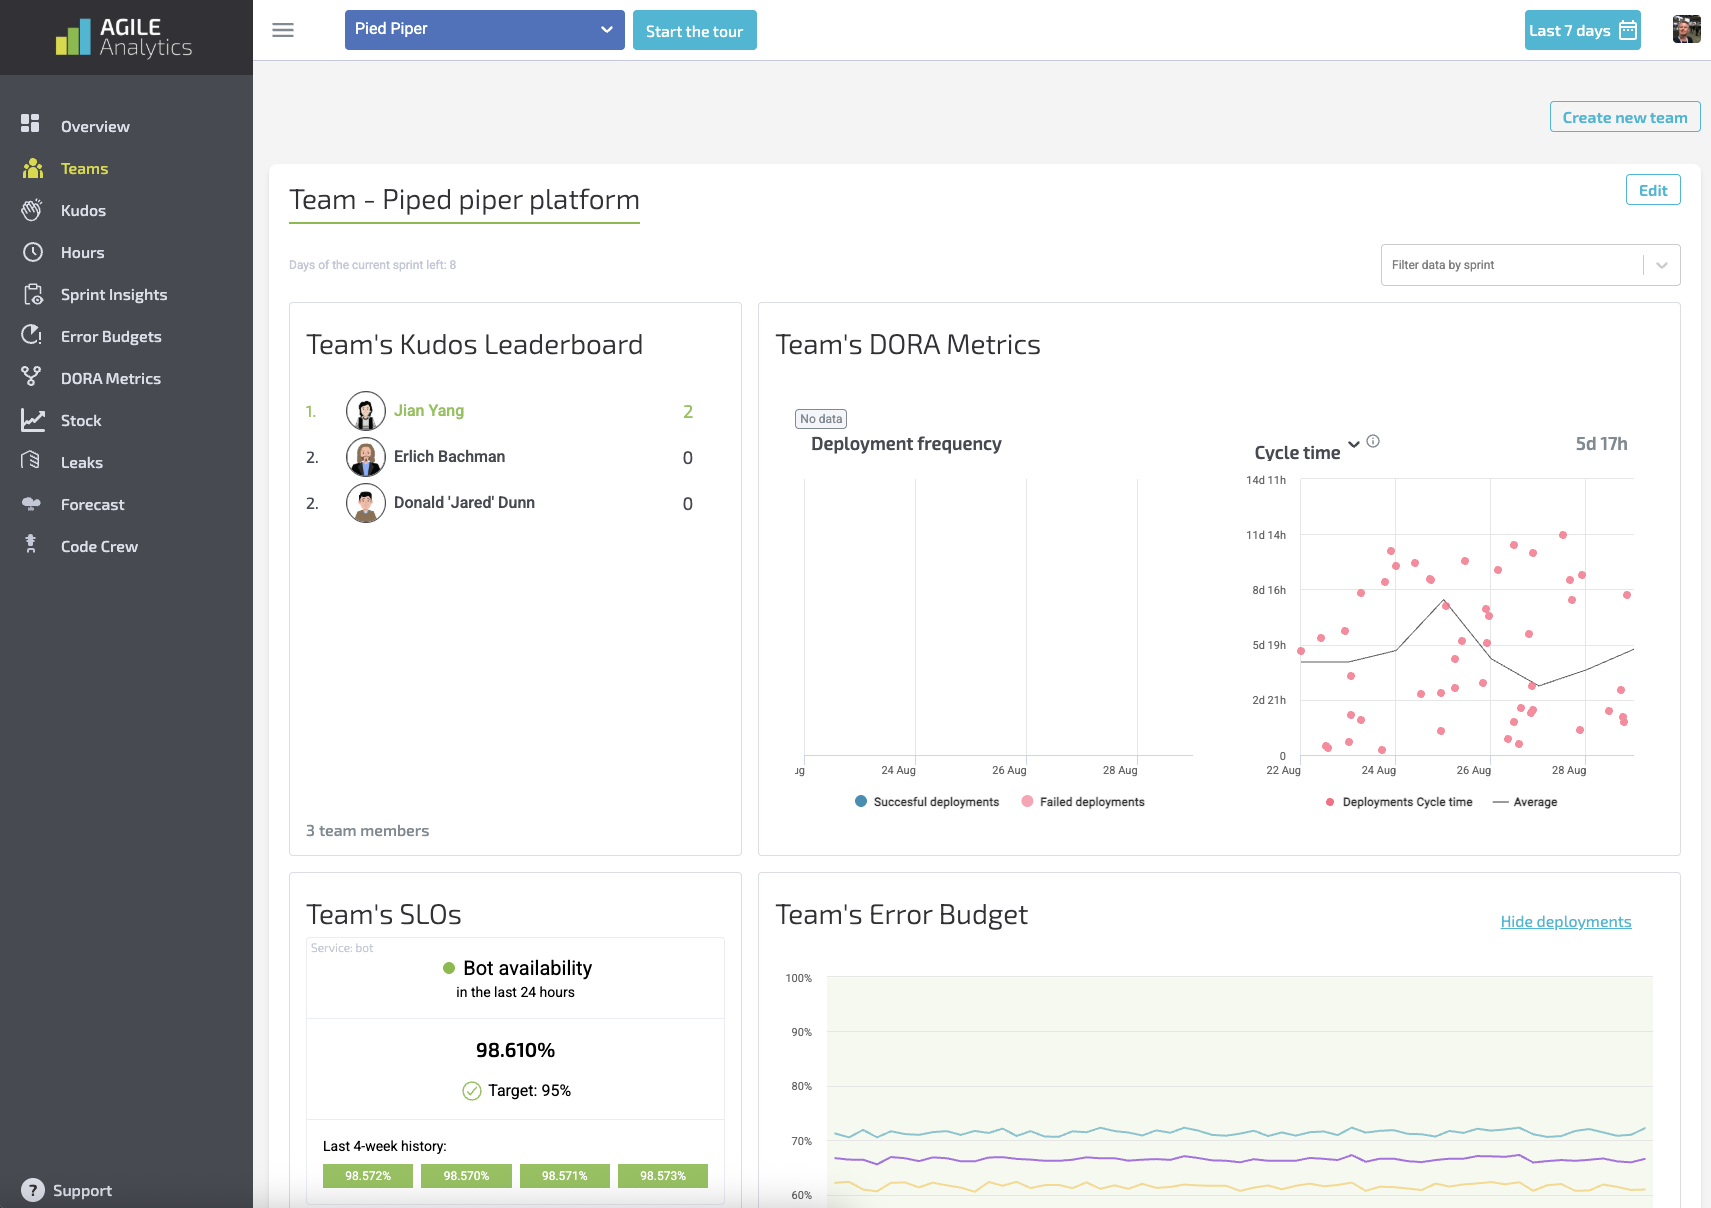
Track team dynamics, throughput, and velocity patterns
-
Team Configuration
-
Team Health Signals
🌟 Kudos
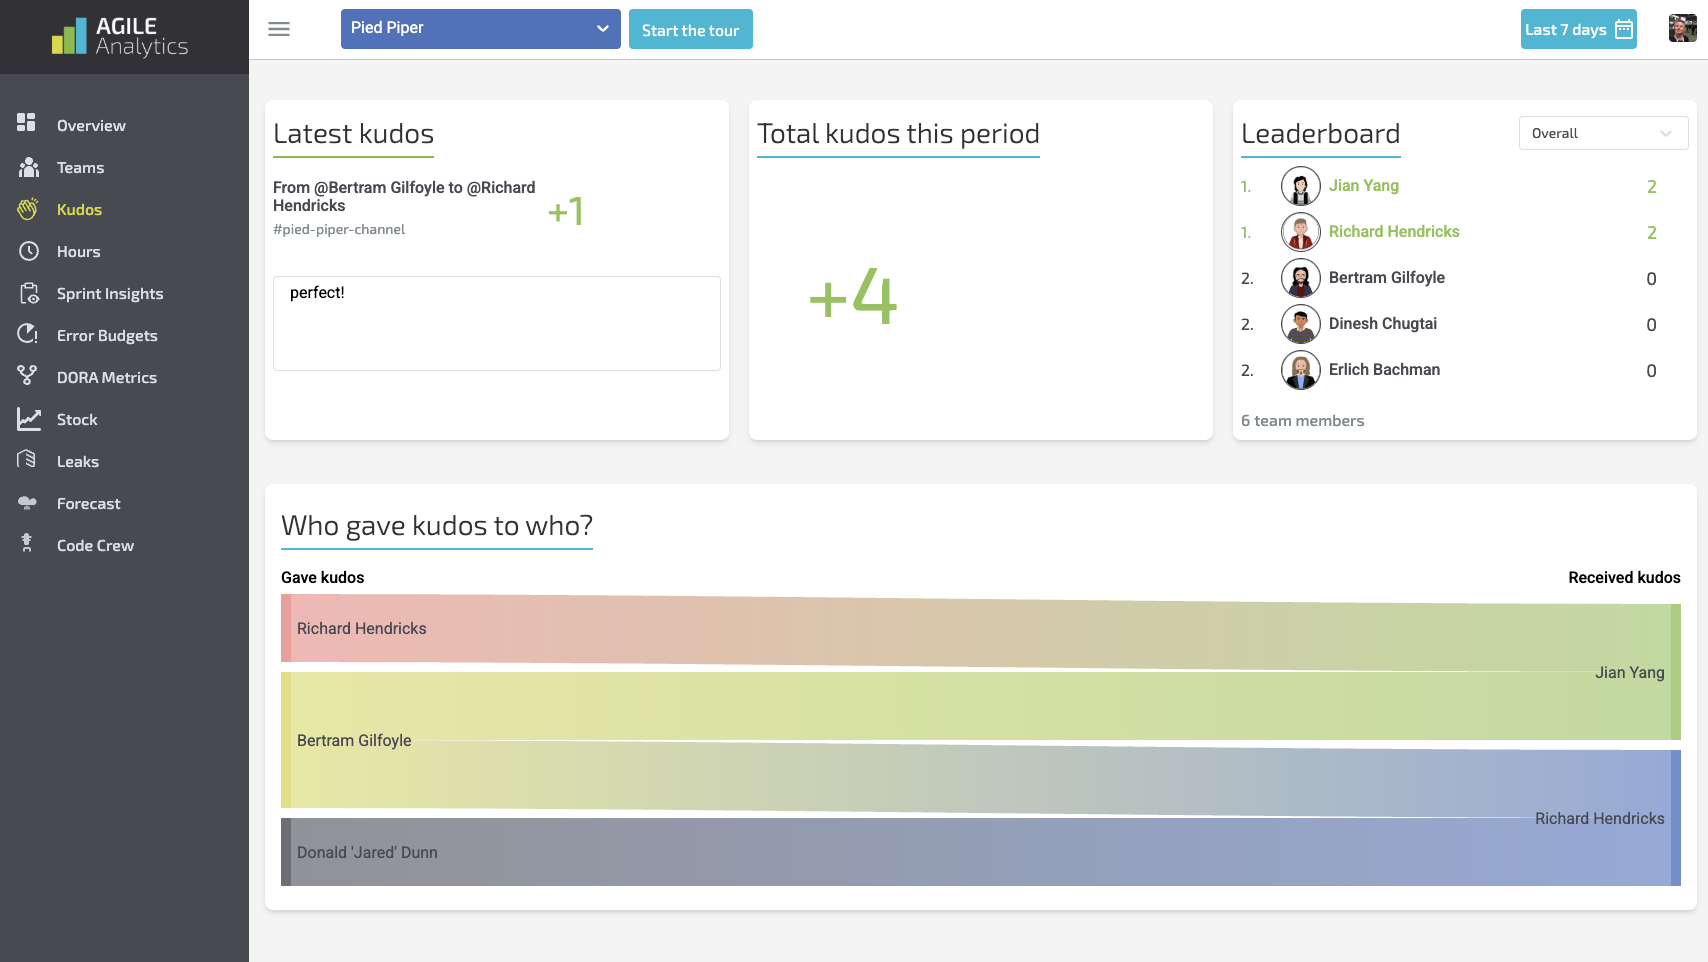
Internal recognition and praise tracking for team morale.
-
Kudos Metrics
⏱ Hours
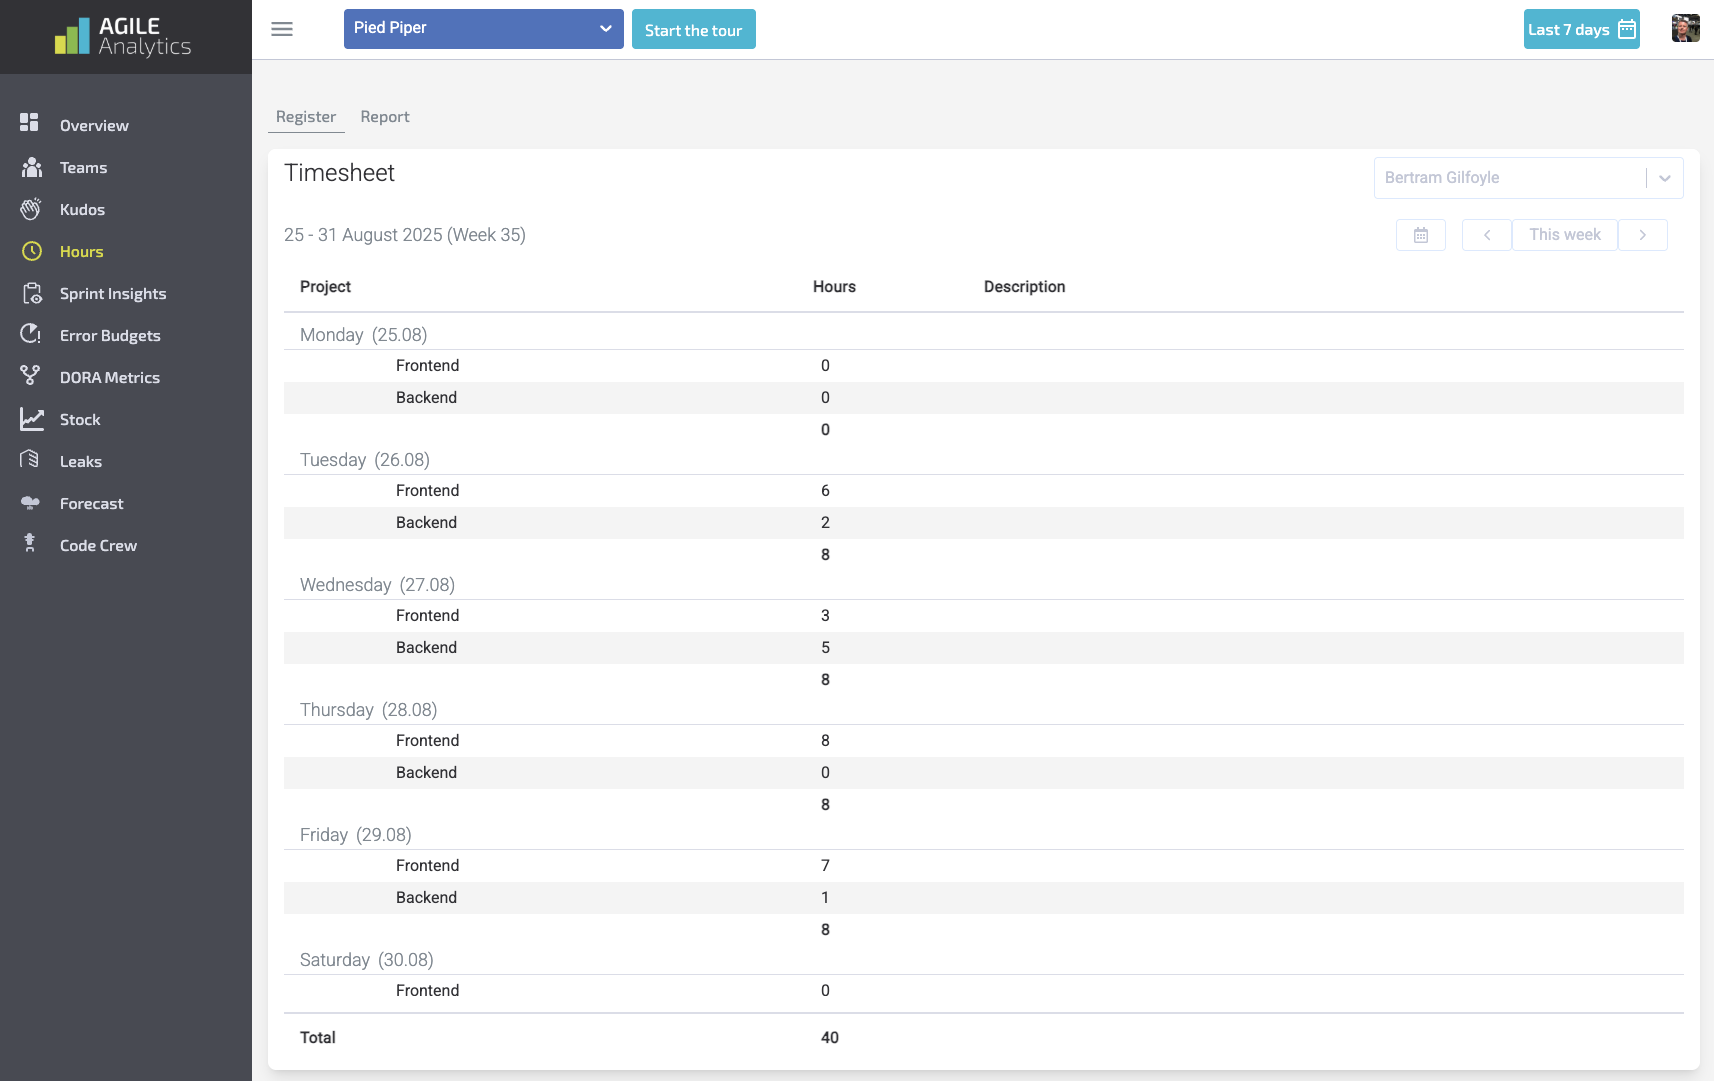
Track logged hours across development efforts and projects.
-
Connecting Time Sources
-
Workload Breakdown
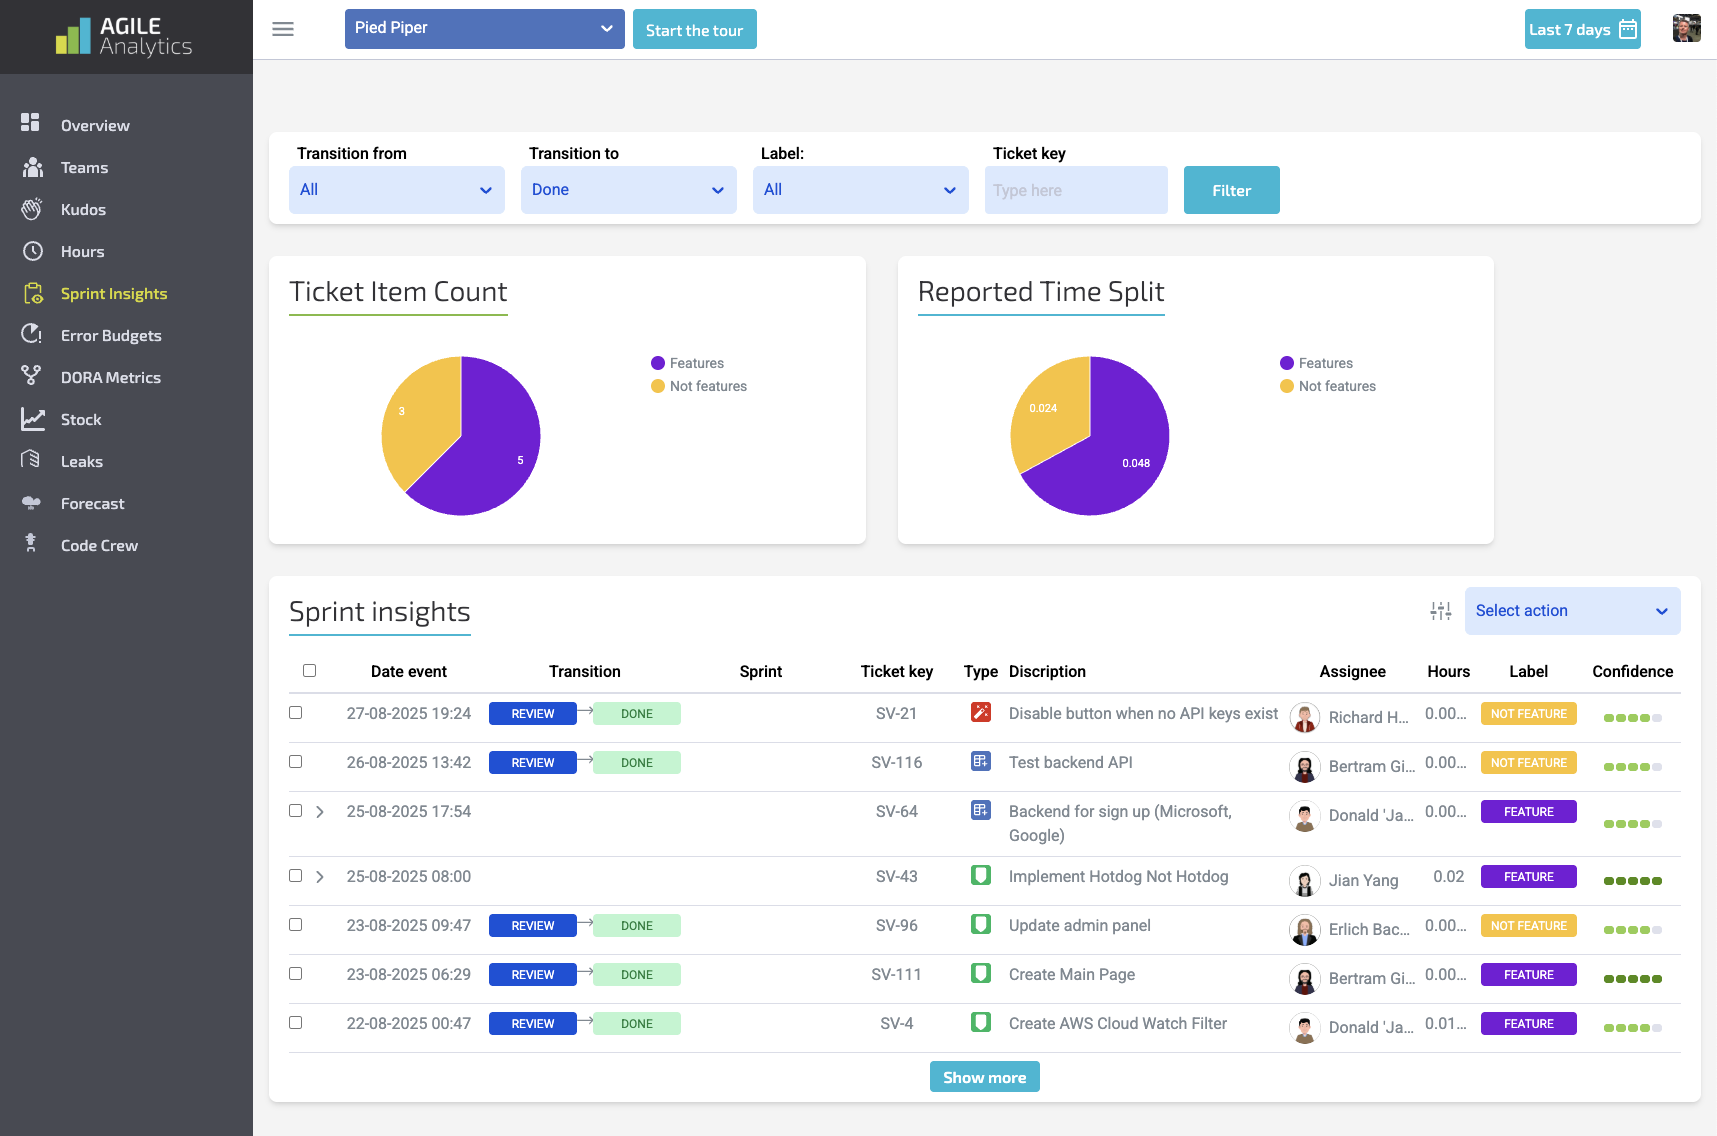
📈Sprint Insights
See where sprint plans diverge from delivery and what caused it.
-
Burndown & Predictability
-
Sprint Flow Metrics
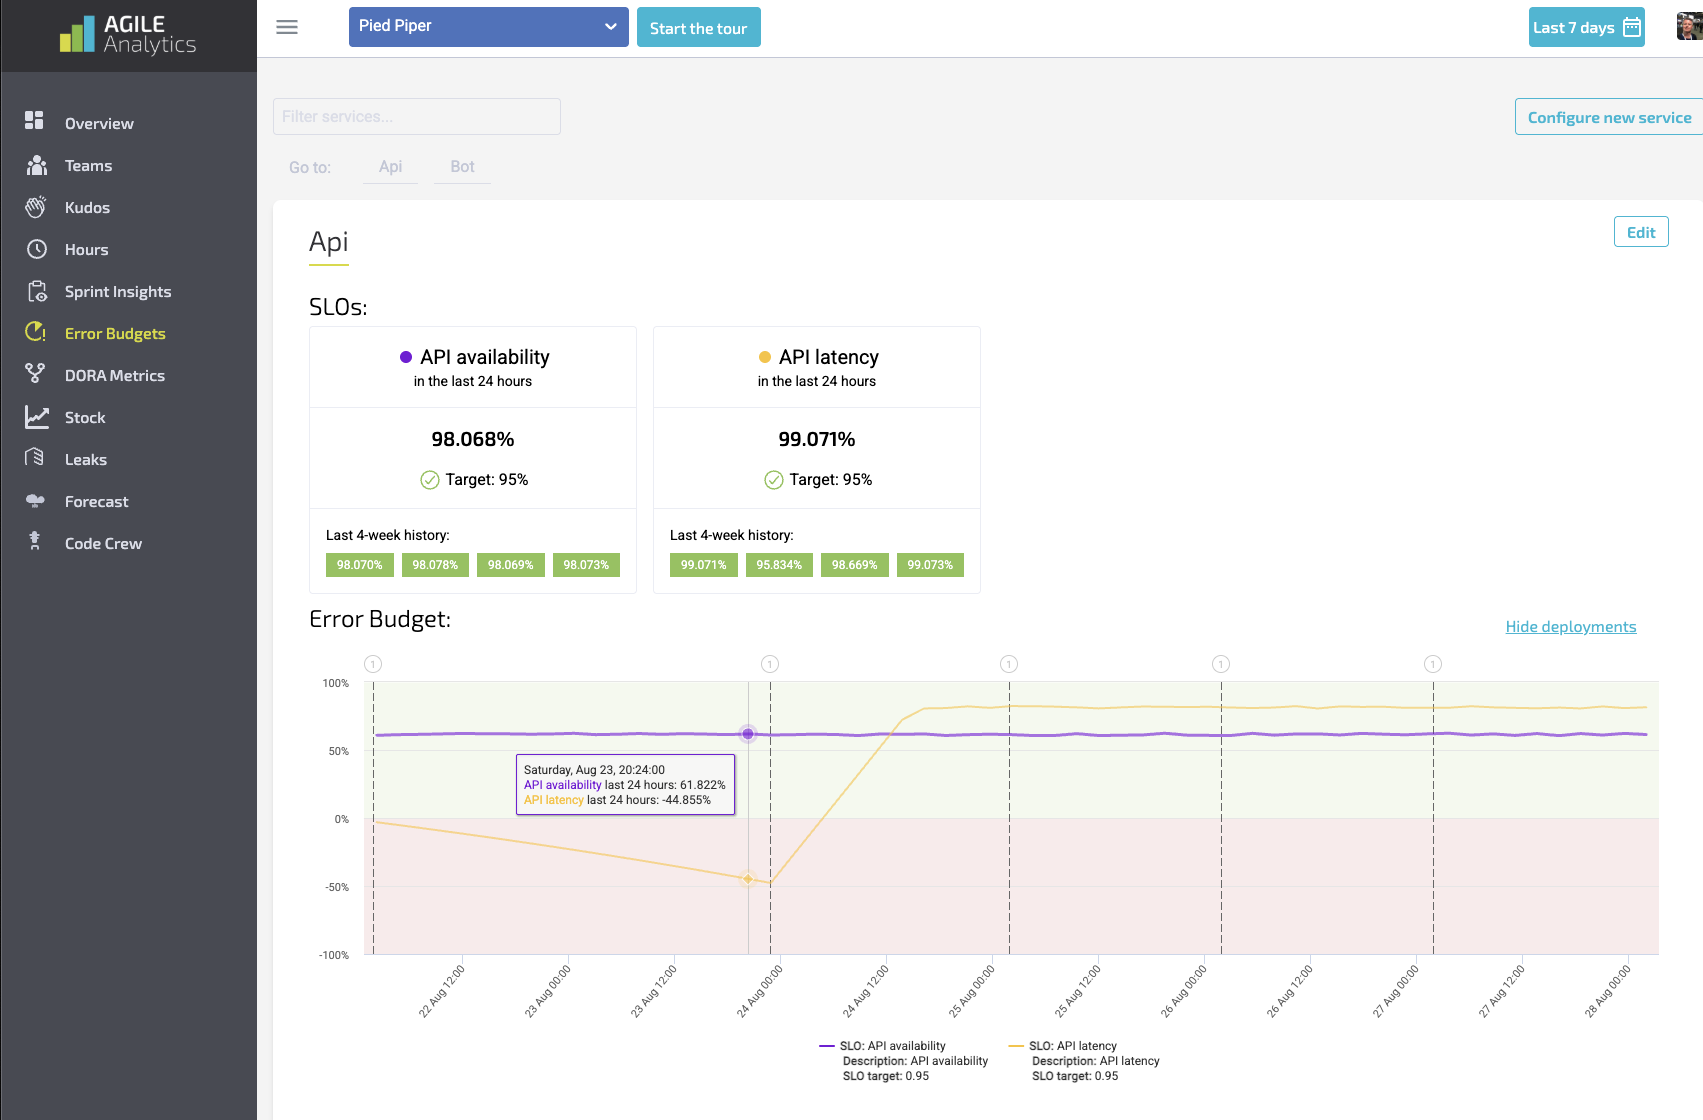
⚠️ Error Budgets
Monitor Service Level Objectives (SLOs) and reliability risk.
-
Setting Up Error Budgets
-
Burn Rate Explained
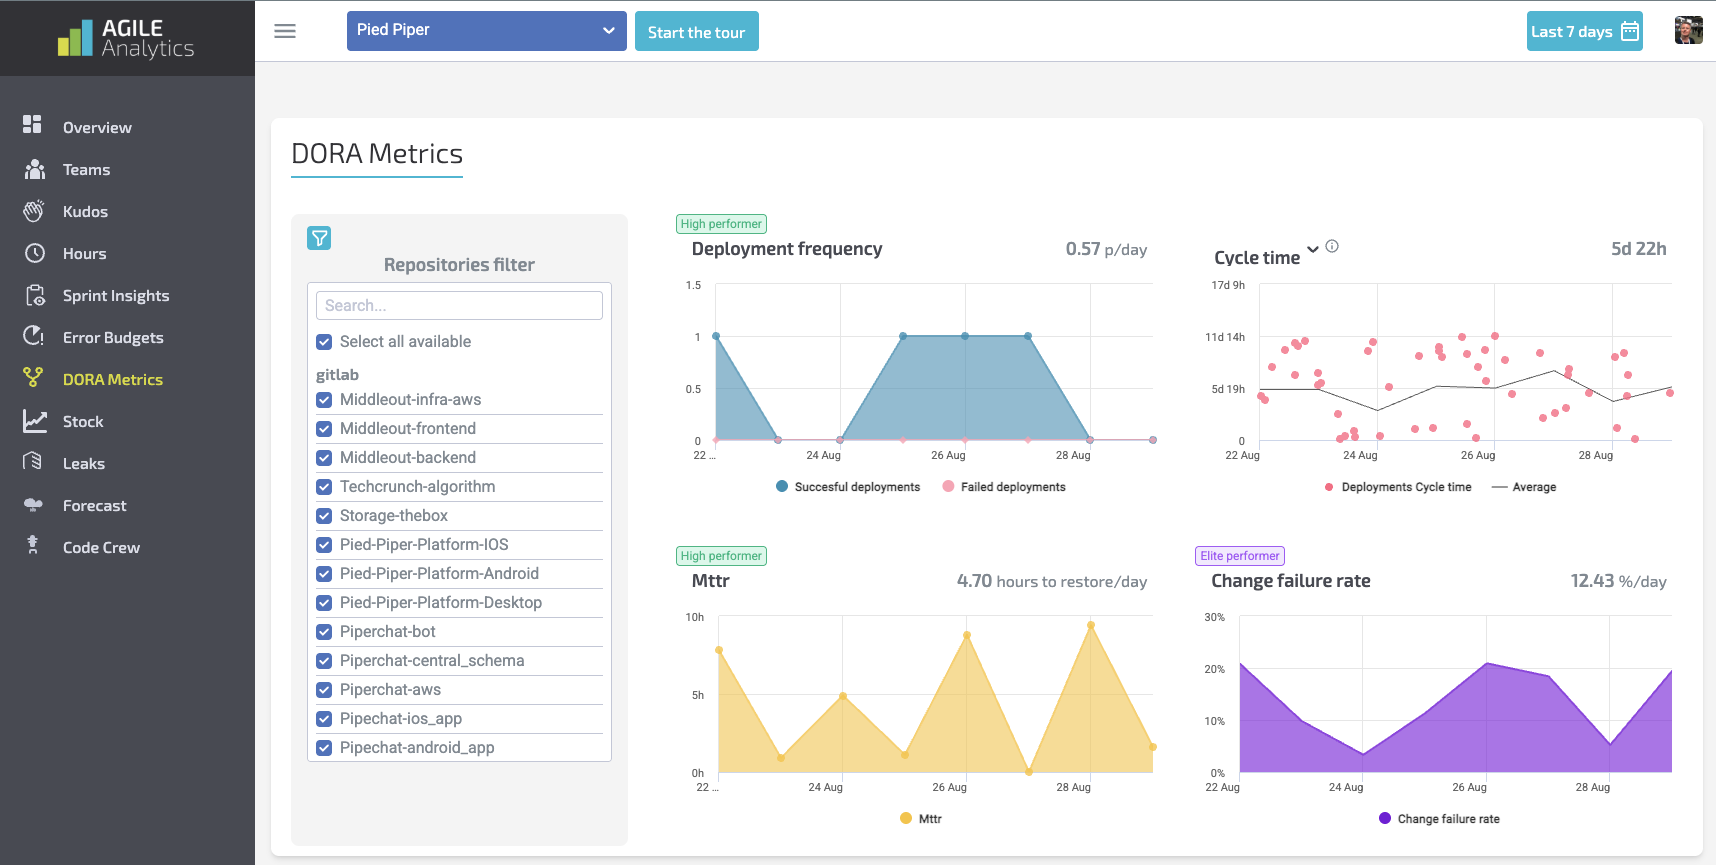
🧮 DORA Metrics
Industry-standard delivery metrics built-in.
-
Lead Time for Changes
-
Deployment Frequency
-
Change Failure Rate
-
MTTR (Recovery Time)
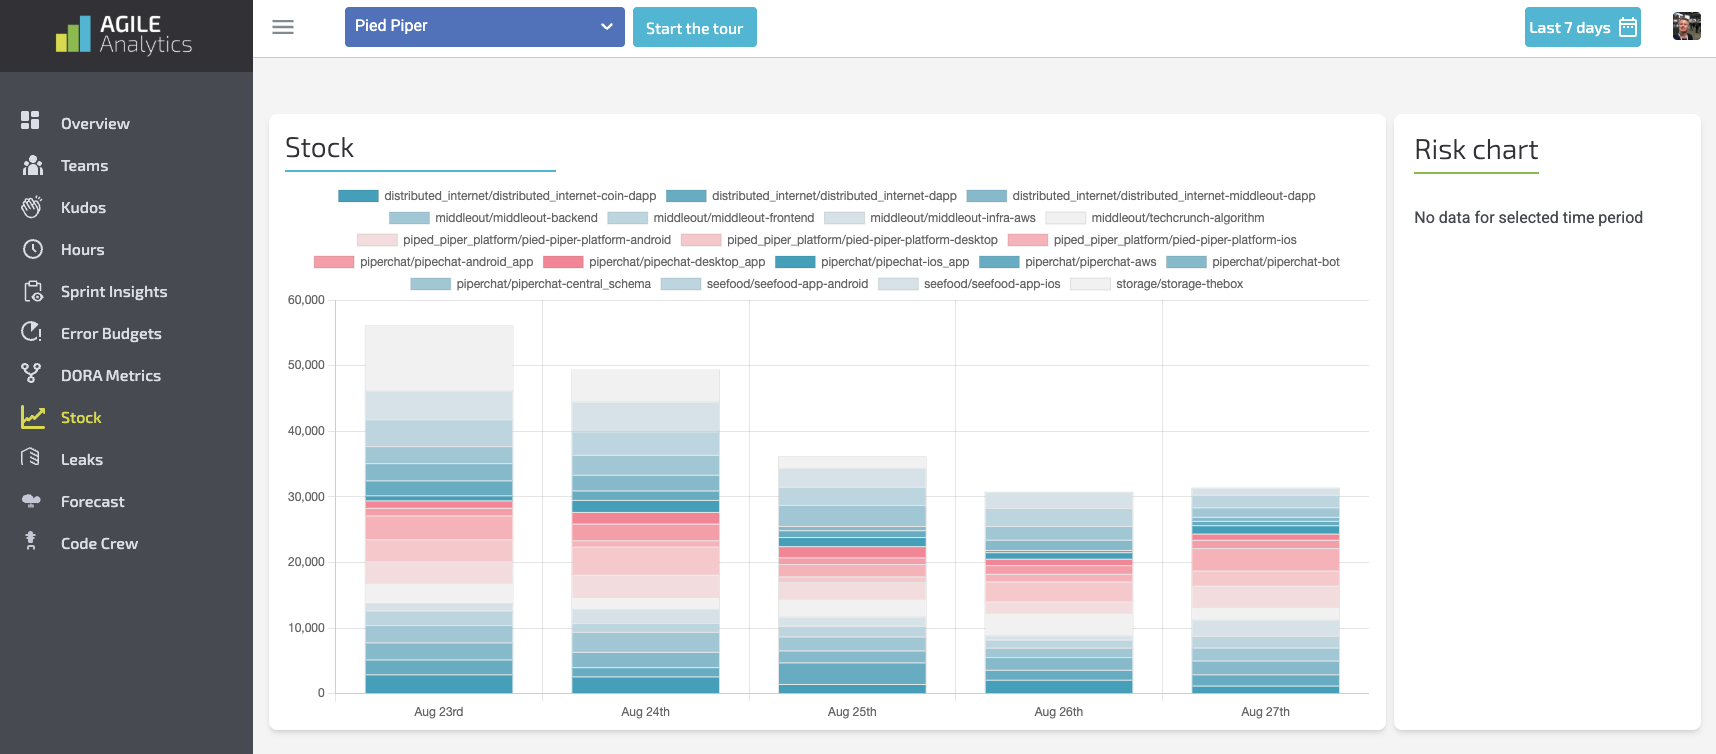
📦 Stock
Track ‘Work in Process’ based on your branches and PRs.
-
Healthy Stock Patterns
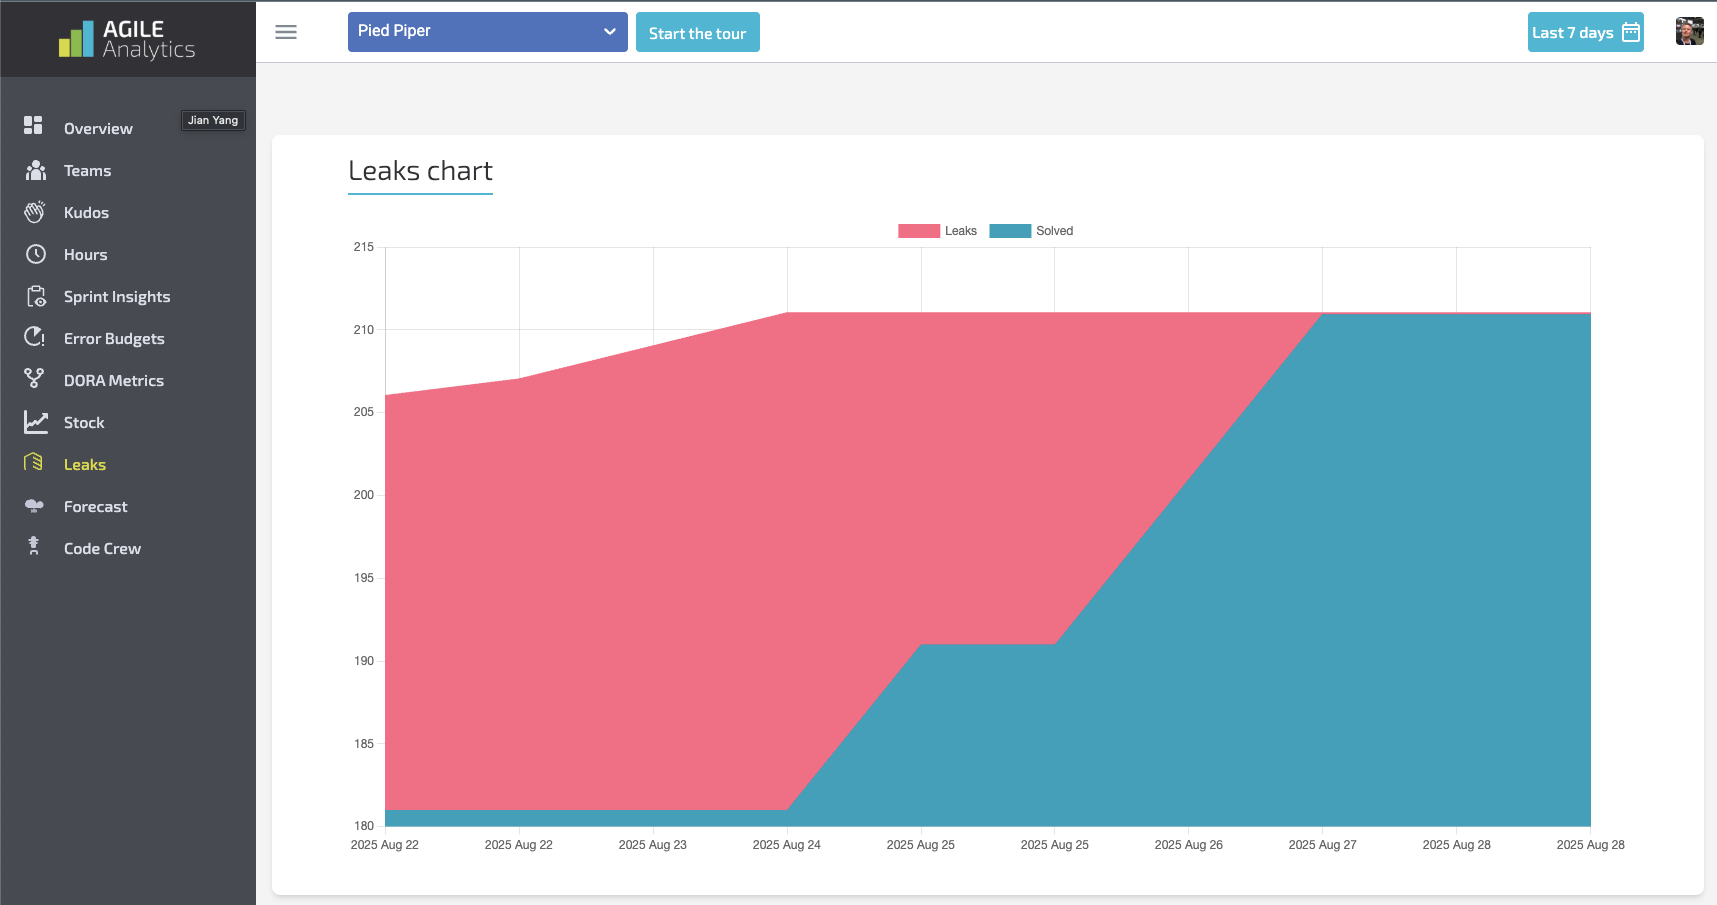
🔐 Leaks
Detect accidental leakage of secrets, tokens, and sensitive keys in commits.
-
Remediation & Scoring
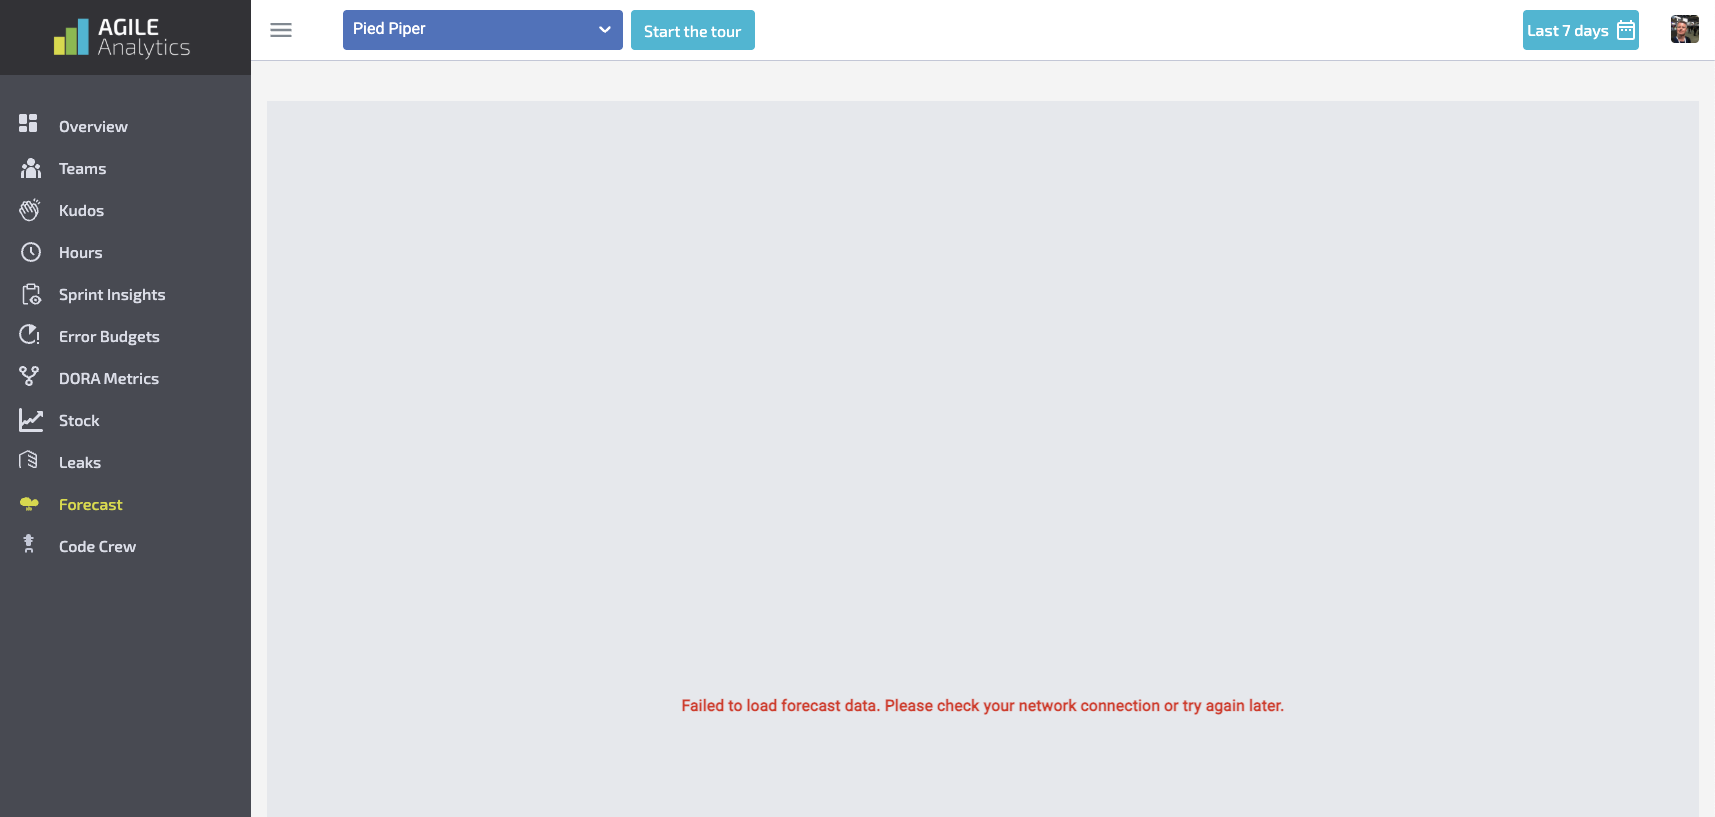
🔮 Forecast
Forecast delivery and work completion based on current velocity.
-
How Forecasting Works
-
Improving Forecast Accuracy
noteTO BE IMPLEMENTED, this screenshot shows that there is no testdata yet
TO BE IMPLEMENTED, this screenshot shows that there is no testdata yet
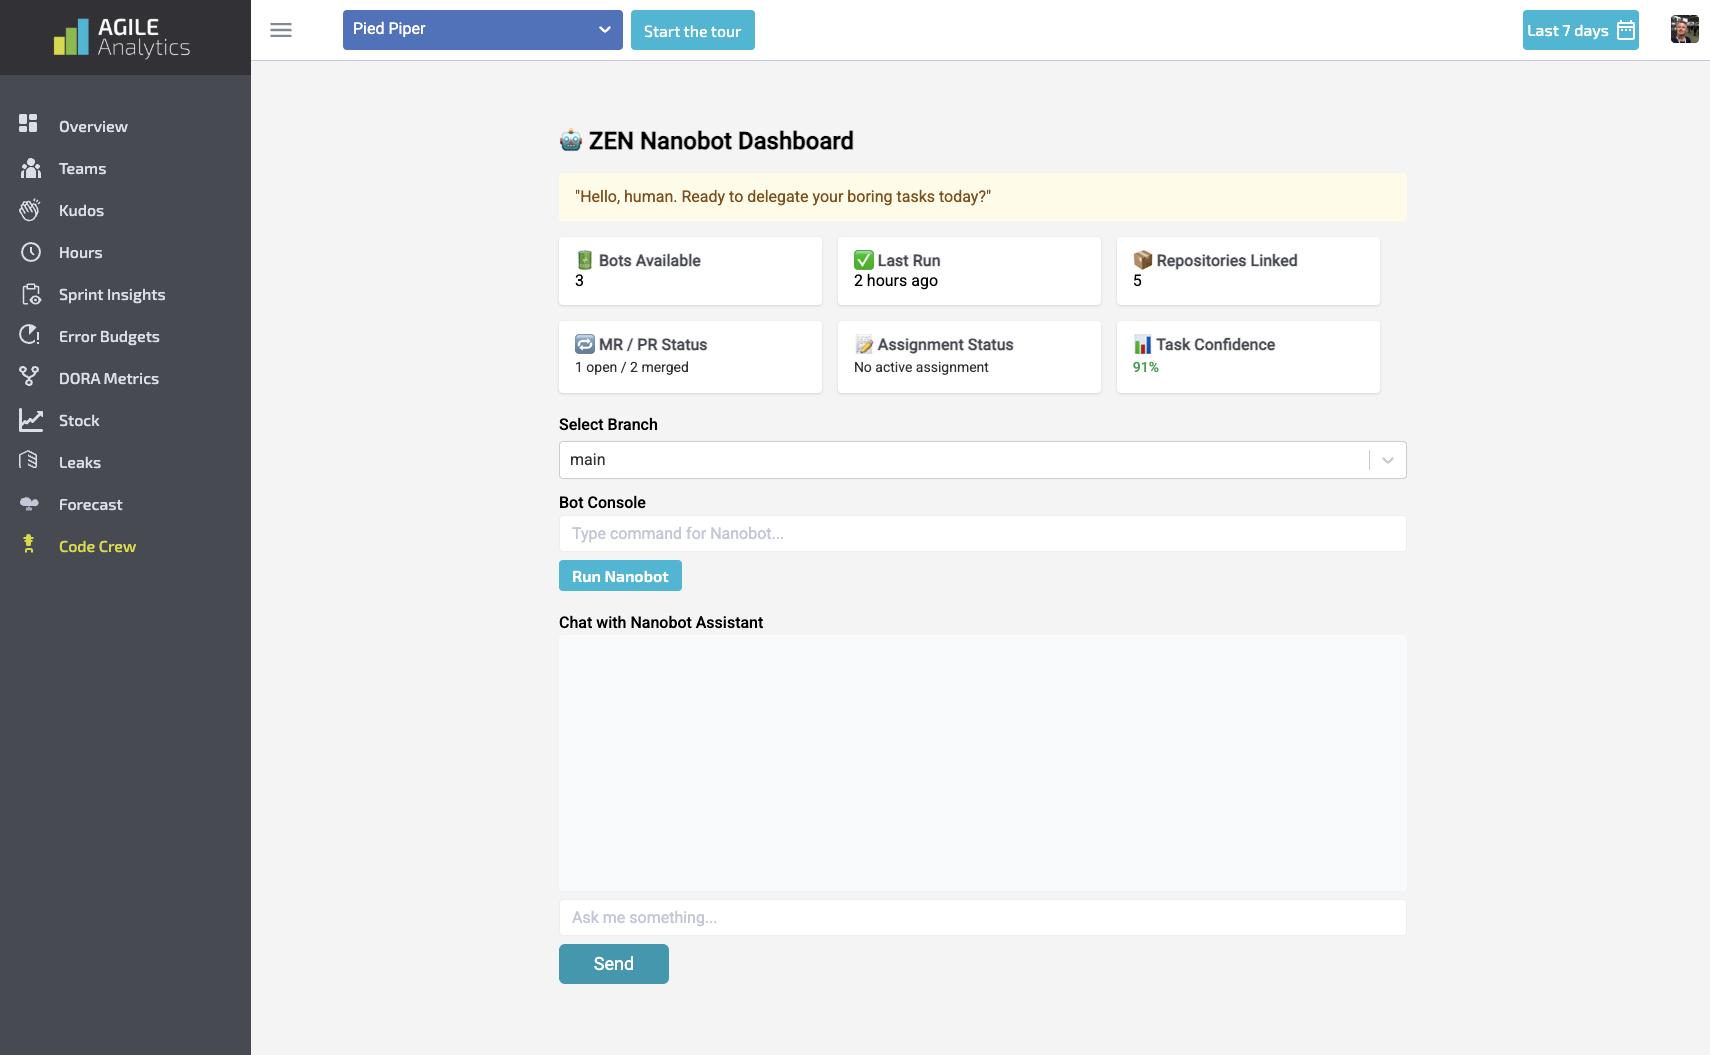
🤖 Code Crew
Your AI maintenance assistant — automates upgrades, refactors, and merge requests.
-
What is Code Crew?
-
How to Use Agents
-
Mission Cards Integration
⚙️ Settings
How to configure the platform, permissions, integrations, and notifications.
-
Organisation
-
Billing
-
SAML
-
Users
-
Kudos
-
Git Providers
-
AA API Keys
-
Jobs Schedule
-
Sprint Insight
-
Error Budgets
📎 Related Concepts & APIs
-
Mission Cards Explained
-
AgileEx, DevEx, OpsEx: Key Definitions
-
Platform Security Model
-
API Reference (Coming Soon)
📞 Need Support?
-
Book a live walkthrough → Schedule a Demo
-
Email → support@agileanalytics.cloud